Code: Select all
// This source code is subject to the terms of the Mozilla Public License 2.0 at https://mozilla.org/MPL/2.0/
// © cageycruz

// This draws a line overlaid on the chart showing a hypothetical asset returning a constant fixed rate of return. The annual percentage ROI can be entered as an input.

// So for example you could enter a target ROI and see how an asset compares to it.

// On a logarithmic chart this will plot a straight line. On linear charts it will plot an exponential curve.

//@version=5
indicator("Const%ROI", overlay=true)

ROIInput = input(7, "Annual ROI (in percent)")
var leftTime = chart.left_visible_bar_time
var leftClose = close

leftClose := (time == leftTime) ? close : leftClose

plot(leftClose * math.pow((1+ROIInput/100), (time_close("") - leftTime) / 365.25 / 24 / 60 / 60 / 1000), color = color.rgb(246, 87, 246, 30))
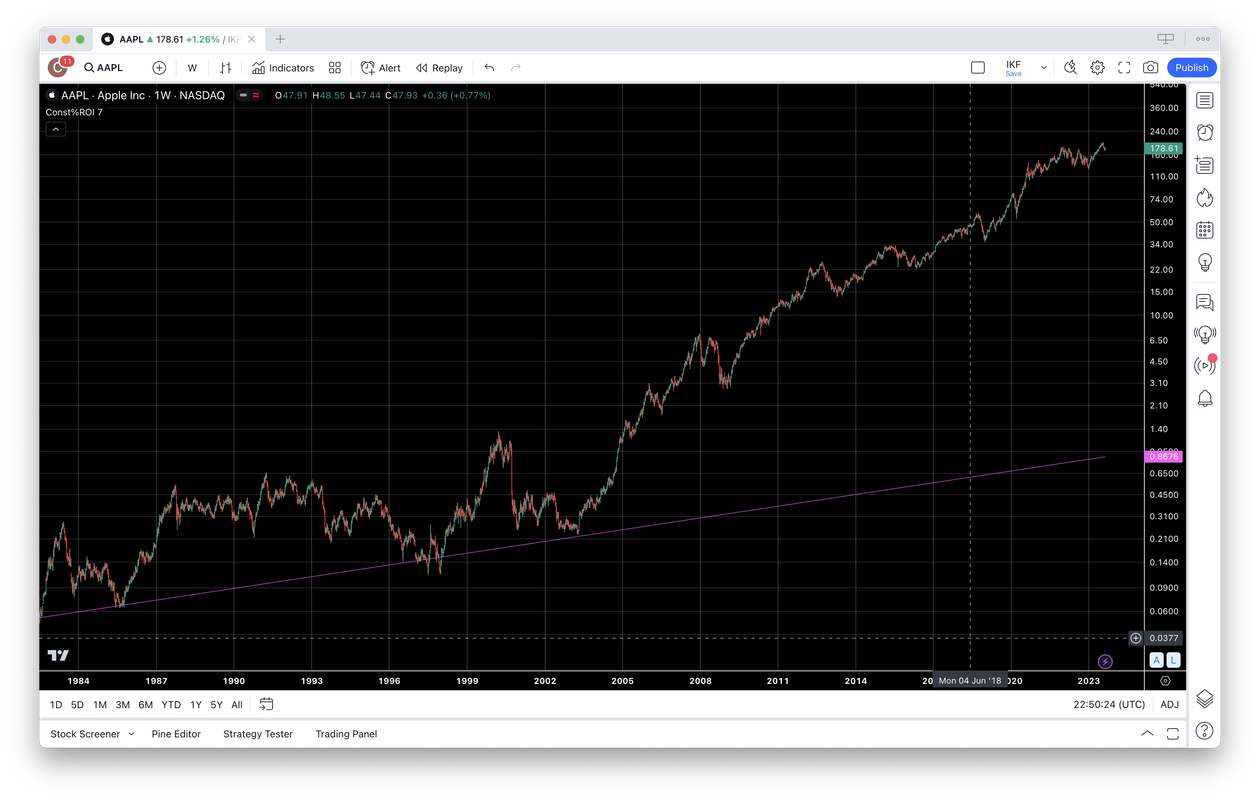
This image shows the Constant % ROI indicator overlaid on a 30 year logarithmic chart of APPL showing how it's price compares to 7% annual return.